
One of the cool things I get to do as a part of my job is gather information for our dynamometer testing procedures. We try to gather real-world operating parameters and duplicate this for our dyno tests. Something that I have noticed while doing this is that the solenoid firing order reference charts are not always 100% accurate; the days of a solenoid just either being on or off are pretty much over for us. The focus of this article is the Toyota AB60, as it has a nice balance of five on/off solenoids: S1, S2, S3, S4, and SR. In addition to those, there are 4 PWM solenoids: SL1, SL2, SLT, and SLU which all operate at about 335 Hz. The test vehicle is a 2008 Toyota Tundra equipped with a 5.7L engine.
While the chart for this unit is fairly accurate, there are a couple things that happen in this transmission that are not documented very well. The equipment that we are using is a Yokogawa DL850V Scopecorder which has 10 channels available to use and has the ability to record at an astonishing speed. We also use one or two Pico 500psi pressure transducers depending on the unit or available pressure ports. I won't go into all the specs of the machine but let's just say this is not your typical automotive scope.
The screenshots that follow are from the Xviewer software (more of the really cool stuff that I get to play with), also from Yokogawa. The software allows you to view the recorded signals from the vehicle, but not only them, as it also has a "math" function where we can see voltage levels, duty cycles, frequency and amplitude, resulting in about 27 different parameters that we can look at.
Referring to figure 2, the top half is the entire recording, and the bottom half is where you can zoom into any particular section from the top and use the cursor to isolate an even smaller part of the recording. That's where the math function comes into play; you can put the cursors A and B on any part of the recording, and the software will automatically do the calculations for you. What I have selected here was "Max Voltage", "Frequency", and "+ Duty Cycle".
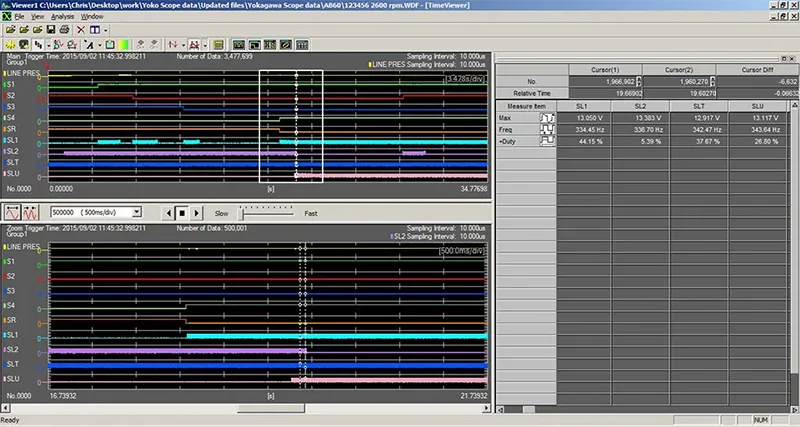
Figure 1
This is about the only solenoid firing order chart I could find for this particular unit:
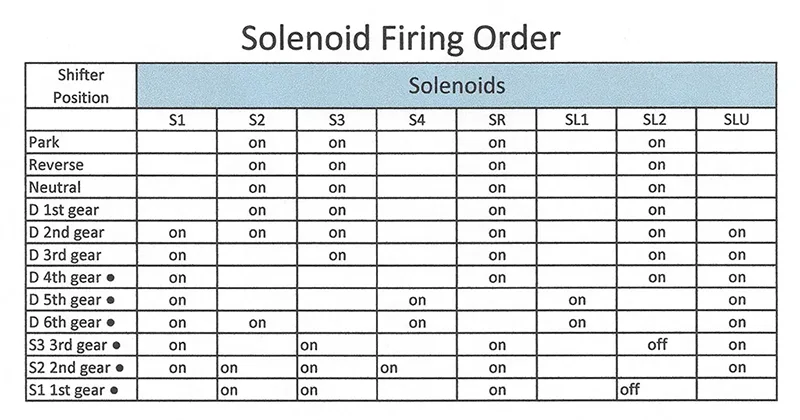
Figure 2
Starting with the SL1 solenoid while referencing the chart shown in figure 3, it shows that the SL1 does not turn on until 5th and 6th gears so let's turn our attention to figure 4, displaying a recording of a 0 to 65mph 1st through 6th gear upshift cycle:
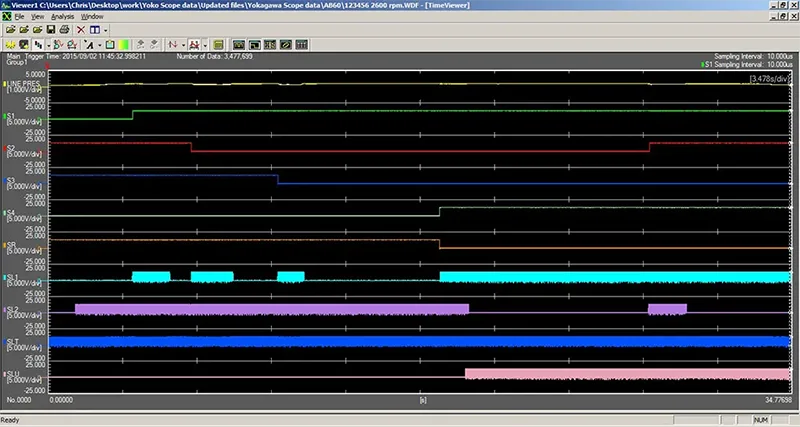
Figure 3
One of the reasons that I chose this unit to use for our example is that it's really easy to see the shift commands from the simple on/off solenoids, but I also wanted to point out that on the 1-2, 2-3 and 3-4 shifts the SL1 ramps up from 0% to 45% and modulates for about 1.5 seconds before shutting off again. Figure 5 is a zoomed-in screenshot of the first three shifts:
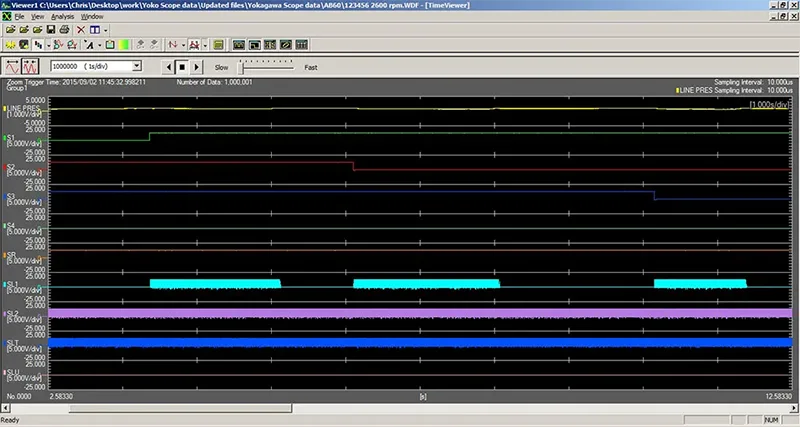
Figure 4
So, from seeing this do you think that SL1 operation could have an effect on any of these shifts? Without knowing this bit of information, if you had a shift-feel issue with any of these shifts, would you even look at the SL1 solenoid? I can tell you that adding simulated operation of this solenoid to the dyno software smoothed the shifts during our tests, and when it was not controlled, the shifts were very quick and bumpy but everything worked and felt fine when the transmission was installed into the vehicle.
The SL2 solenoid is on 1st through 4th gears as shown on the chart, but what the chart does not tell you is that it also turns back on and modulates during the 5-6 shift, just like the SL1 did on the lower ratios. This solenoid also has an effect on shift feel for the 5-6 shift, and a closer view of this operation can be seen in figure 6:
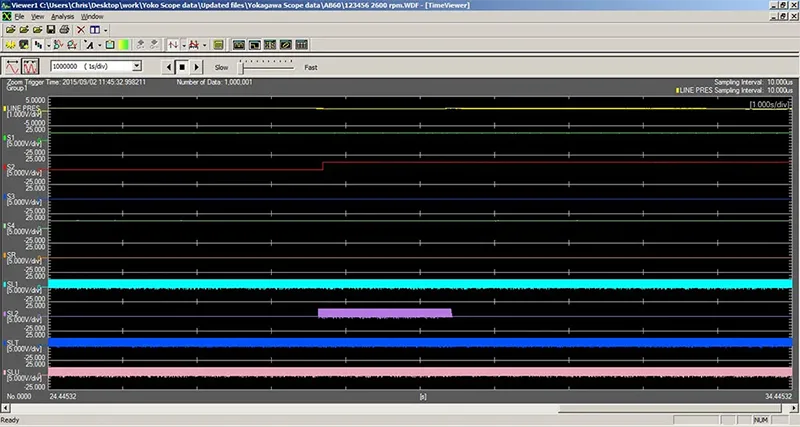
Figure 5
The other strange thing that happens is while the vehicle is stationary in drive the SL2 solenoid is not on while you have your foot on the brake. Huh? Take a look at the beginning of the recording in figure 4, and also figure 7. Simply sitting still in Park, and when I push on the brake pedal, the S4 and SL1 turn on and the SR and SL2 turn off and then reverse when the brake is released.
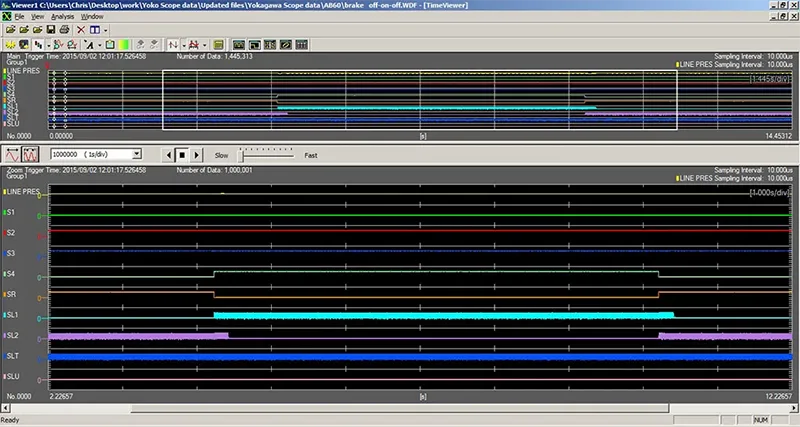
Figure 6
This is something that we are seeing more and more of where an input, such as a brake switch or a throttle position sensor voltage change, has a direct impact on solenoid operation or even line pressure where the computer (whether it be a TCM or PCM) is anticipating a change in state from the operator. Another example of this is shown in figure 8:
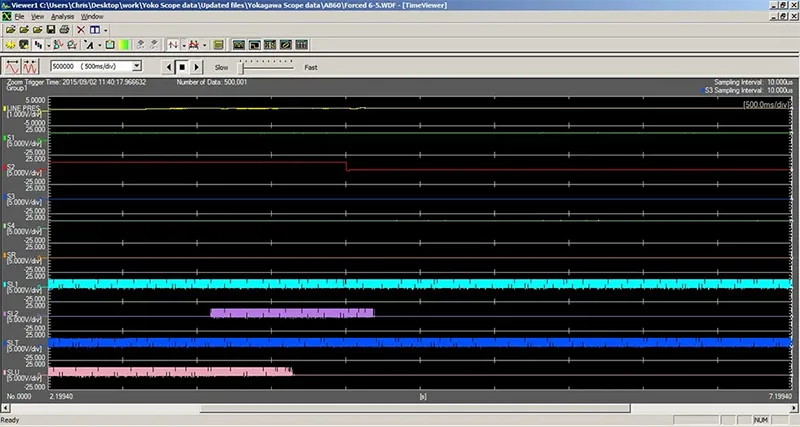
Figure 7
This is a forced 6-5 downshift. As you can see, the SL2 turns on and modulates almost 1 second (the scope view is set at 500ms per division) before the S2 is commanded off to make the 6-5 downshift. You obviously cannot tell this from the screenshot, but the SL2 starts at 35% + Duty Cycle and ramps up to 50% right before the shift, and then tapers off quickly off after. Here are some pressure specs for you: @ idle in PRND 56psi the SLT solenoid operates at 63% + Duty Cycle. Drive-stall 210psi @ 33% + Duty Cycle and Reverse stall 230psi @ 23% + Duty Cycle.
This transmission is just one example, and there are many others that have similar discrepancies in operation. We have scoped and recorded the operation of 33 different units so far, and have many more to go. This process is an integral part of our R&D procedures and new-product development. Dealing with this is just another thing that we as "Transmission Guys" have to be aware of and always try to think outside of the box when it comes to a strange issue. Use all the resources available to you, and if there is anything that does not seem correct or does not seem to make sense to you, get out the scope or meter and start testing.