
As the Lead Diagnostician for Certified Transmission, part of my role involves research & development for newer transmission models that we are rolling out for sale. As a company, we are constantly working on new unit development and continually improving our existing product lines. These are just a couple of ways that we are always committed to our culture of "Continuous Improvement".
Recently we had a chance to do some work with the Ford 10R80. We have easy access to test vehicles since our owner also owns a used car dealership. For our R&D testing we used a 2019 F150 equipped with a 5.0L Engine and the 10R80 Transmission. I got to play around and do some scope testing on it. I'm so happy that both Ford and GM had decided to move the transmission control back outside of the unit! It sure makes this kind of testing easier to accomplish!
I am sure most of you have seen the articles and tech bulletins about this unit: it utilizes six shift solenoids, a N.H. (normally high) LPC solenoid and a N.L. (normally low) TCC solenoid. The shift solenoids are what Ford refers to as CIDAS (Casting Integrated Direct Acting Solenoid), which basically means that there is no fluid flowing through them so the pintle movement acts directly on a valve. The scope captures referenced below are at a sample rate of 10us (micro seconds).
I had a Yokogawa scope connected to all eight solenoids and a 0-500psi Pico pressure transducer connected to the line pressure service port. What I ended up with was PWM (pulse width modulation) solenoid control I have never seen before. Neither the duty cycle nor the frequency remains consistent. We have all seen normal square wave patterns with variable PWM control, but I had never seen what a 10R80 pattern looks like. Obviously, I am not an electrical engineer, just a transmission guy, so the best I could describe it is if you had a rolling TCC surge on a 4L60E and the duty cycle kept changing to try to accommodate for the slip. (Figure 1)
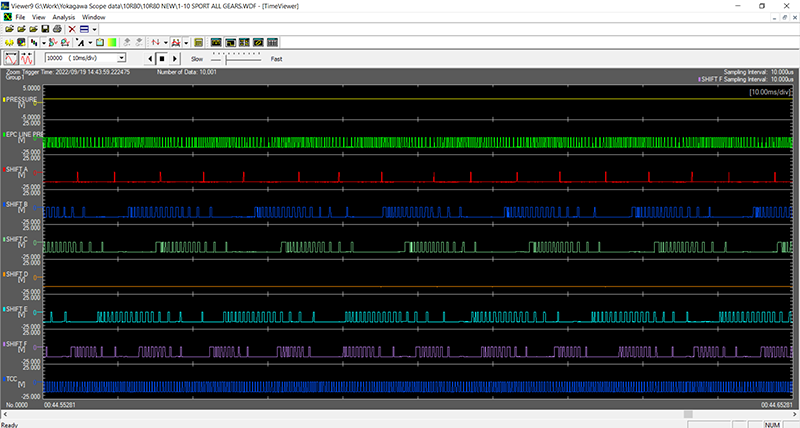
Figure 1
This shows a good example of shift solenoid operation in ninth gear. SSA and SSD are clearly OFF (although SSA has a high spike about every 5ms), while SSB, SSC, SSE, and SSF are all ON but not in a manner we are used to seeing. Focusing on SSB, we see the duty cycle does change a bit but looking at the Hz is where you can see a big difference. The scope software has a very good math function which is the only way you can see frequency. At different points on the screen, the Hz changes from about 625Hz to 7150Hz; the higher Hz occurs right after the longer initial turn-on. All the data on the screen is scaled at 100ms.
The TCC solenoid operation is the most consistent, probably because it is more like a traditional solenoid we are used to seeing. Cruising with light load, duty cycle varies between 35-45% and Hz between 2.6KHz - 3.5KHz.
I was hoping to provide some line pressure to duty cycle specs, but even at a steady line pressure reading the Hz & duty cycles change so much it is difficult to put into a format that would make any sense. I do want to bring up some discrepancies I see with service information that is out there though, and probably came from Ford. (Figure 2)
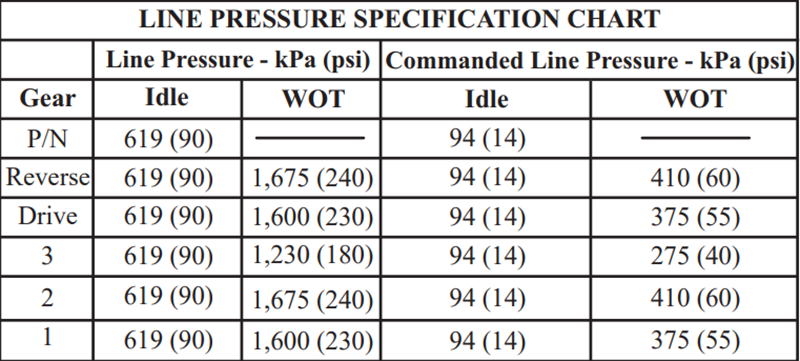
Figure 2
Reverse WOT stall spec is 240. When at full stall in R the EPC shuts off and the pressure looks like a sine wave between 239-305 psi, even when the solenoid turns on again. This surge continues until you start to lift off the throttle. This being said, your pressure gauge is going to be "spiky". (Figure 3)
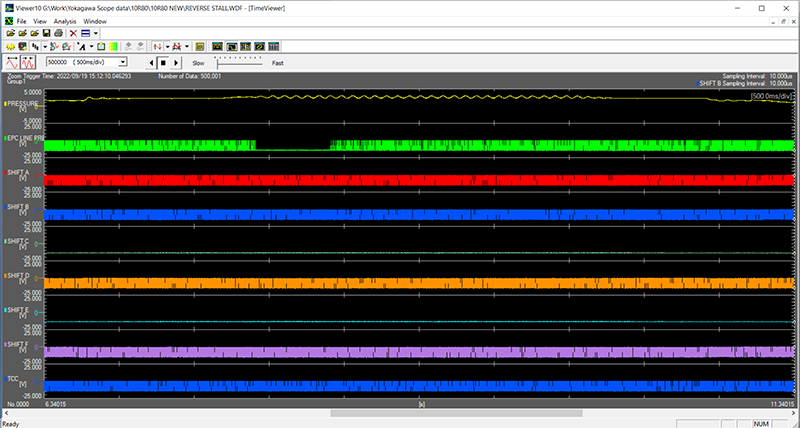
Figure 3
I am going to say this is normal as it exhibited this behavior with both a used and brand-new valve body. On the other end the charts I have seen all specs showing 90psi @ idle in all ranges, but what I saw in reality was 72-75 @ idle in all ranges.
On the Park to Drive garage shift we have some conflicting info from the solenoid application chart. (Figure 4)
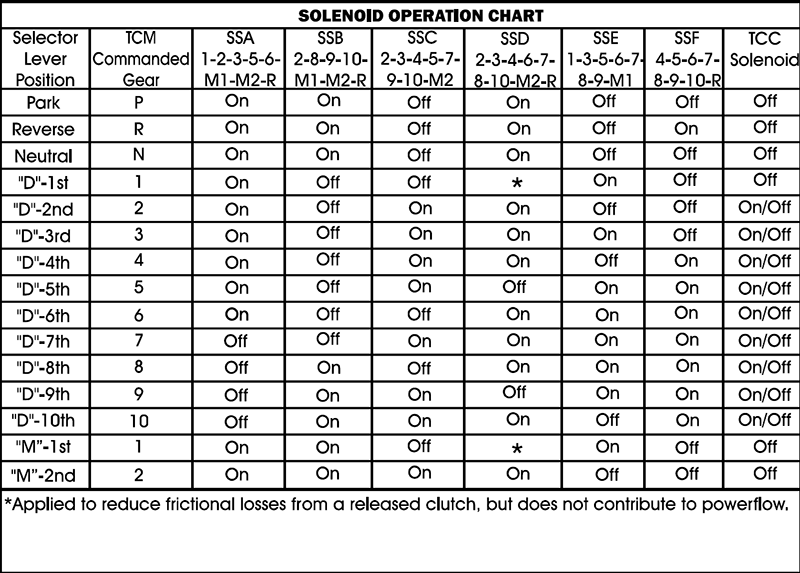
Figure 4
The chart shows SSB is on in Neutral and turns off when D1 is commanded. I don't really see that on the scope capture. (Figure 5)
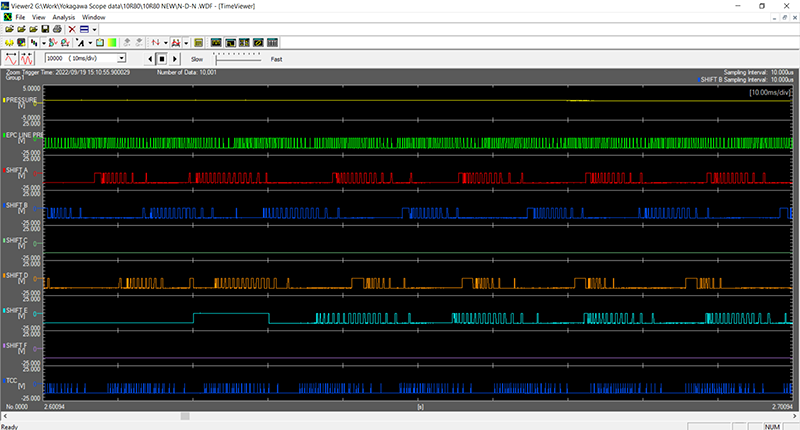
Figure 5
SSE turns on with a long pulse 'high', and then starts regulating. Park to Reverse operates similarly when SSF is turning on. The difference that I see with this one is with SSD. (Figure 6)
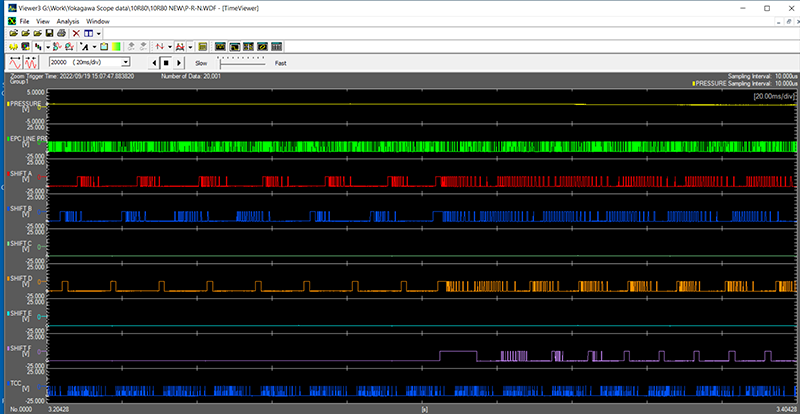
Figure 6
Where the chart shows SSD is on in both Park and Reverse, actual monitoring shows it changing from a slow 77Hz/12% positive duty cycle to a fast 2.2727Khz/50% duty cycle. It is not just as simple as an on/off solenoid chart, and I think these charts can be a bit deceiving just by looking at them. This is especially true when diagnosing with a DVOM. You think the solenoid is off according to the chart, but you still see voltage on your meter. This could lead you down the wrong path if you are looking at solenoid activity. On any of these newer units, you must be using a scope for this testing.
One last thing I found quite interesting: during every up-shift event (except for 3-4), line pressure went to max command in forward ranges @ 240psi. The scope shows a 1st through 10th 0 mph to 75 mph run that took 50 seconds. The channel legend is included below in case it isn't clear in the image. (Figure 7)
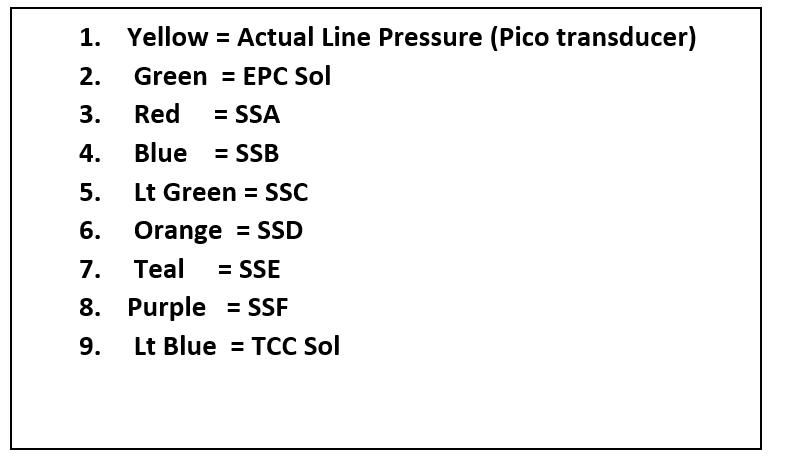
Figure 7